How Odoo KPI Tracking Features Improve Dashboard in Odoo
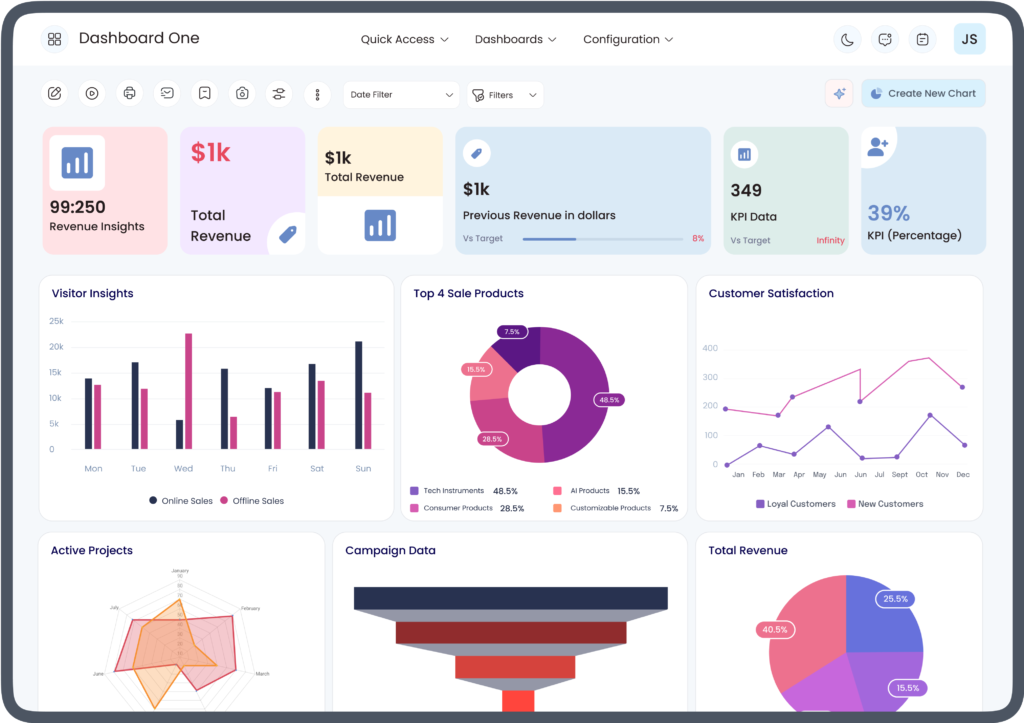
Businesses generate large amounts of operational data across sales, accounting, inventory, customer relationships, projects, and other functions. However, having data available does not automatically make it useful. Decision-makers need a practical way to organize important metrics, monitor performance, and identify changes that require attention.
This is where Odoo KPI tracking features and a dashboard in Odoo can work together. KPI tracking helps businesses define and monitor measurable performance indicators, while dashboards provide a visual environment for reviewing important information. When these capabilities are configured around relevant business objectives, users can move from raw operational data toward more structured performance monitoring.
What Are Odoo KPI Tracking Features?
Odoo KPI tracking features refer to the capabilities used to monitor key performance indicators across business operations. KPIs are measurable values that help organizations understand whether specific activities are progressing according to defined objectives.
Depending on the Odoo applications and configuration being used, businesses may track indicators related to sales, revenue, invoices, inventory, purchasing, projects, customer activities, or other operational processes.
Examples of business KPIs include:
- Sales performance
- Revenue and invoicing activity
- Outstanding receivables
- Inventory levels
- Purchase activity
- Project progress
- Lead and opportunity activity
- Customer-related performance
- Operational workload
The important point is that a KPI should have a clear purpose. Simply displaying a large number of metrics can make a dashboard difficult to interpret.
What Is a Dashboard in Odoo?
A dashboard in Odoo is a visual workspace where relevant business information can be presented through reporting elements and performance indicators. Instead of reviewing information separately across multiple records or applications, users can organize important information into a more accessible view.
The exact dashboard capabilities available depend on the Odoo version, installed applications, configuration, and any additional reporting tools being used.
A useful dashboard can help users quickly review questions such as:
- What is happening in the business?
- Which KPIs require attention?
- Are current activities moving toward business objectives?
- Where are operational changes occurring?
- Which areas require deeper analysis?
This makes the dashboard a practical layer between business data and everyday decision-making.
How Odoo KPI Tracking Features Improve Dashboard in Odoo
1. Turns Business Data Into Measurable KPIs
One of the biggest advantages of KPI tracking is that it gives business data a measurable context. Instead of looking at individual records without a broader objective, users can focus on indicators connected to business performance.
For example, a sales team may monitor sales activity, opportunities, quotations, and revenue-related information. A finance team may focus on invoices, receivables, and payment activity.
When these indicators are presented through a dashboard in Odoo, users can access the information in a more structured format.
2. Provides a Centralized View of Performance
Business information is often distributed across different departments. Sales teams, finance departments, inventory managers, and project teams may each have different reporting requirements.
A well-designed Odoo dashboard can bring selected KPIs into a centralized view. This reduces the need to manually gather information from multiple operational areas before reviewing performance.
Centralization is particularly useful for managers who need a high-level overview before investigating individual records.
3. Makes Performance Trends Easier to Understand
A KPI becomes more useful when it can be reviewed over time. Historical information can help users recognize whether a metric is increasing, decreasing, or remaining relatively stable.
For example, a business may monitor sales activity over different periods to identify changes in performance. Similarly, inventory-related indicators can help users observe changes in stock levels.
When suitable visualizations are available, a dashboard in Odoo can make these patterns easier to interpret than a long list of individual records.
4. Supports Faster Business Monitoring
Managers often do not have time to examine every transaction before making routine operational decisions. KPI-based dashboards provide a way to focus attention on selected performance indicators.
Instead of navigating through multiple screens, users can begin with the dashboard and then investigate the underlying information when something requires further analysis.
This creates a practical workflow:
KPI → Dashboard View → Identify Change → Investigate Data → Take Action
The dashboard therefore acts as a starting point for business analysis rather than replacing detailed reporting.
5. Helps Connect Departmental KPIs With Business Goals
KPIs are most useful when they reflect actual business priorities. A company focused on increasing sales may monitor sales and opportunity-related indicators, while an organization focused on operational efficiency may prioritize inventory, purchasing, or project metrics.
Odoo KPI tracking features can support this approach by allowing businesses to focus reporting around their operational objectives.
A dashboard can then present those selected KPIs in a format that is relevant to the people using it.
6. Improves Visibility Into Sales Performance
Sales teams can benefit from KPI tracking because sales processes generate numerous measurable activities. Depending on the company’s configuration, useful indicators may include quotations, sales orders, opportunities, revenue, and other sales-related information.
Displaying relevant sales KPIs within a dashboard can give sales managers a consolidated view of activity.
For example, a manager may notice a change in opportunity activity and then open the relevant records for further investigation. This connects dashboard monitoring with detailed CRM and sales workflows.
7. Supports Financial Performance Monitoring
Finance teams need timely visibility into financial operations. Depending on the organization’s reporting requirements, dashboards may present indicators related to invoices, receivables, payments, expenses, or other accounting activities.
The benefit of KPI tracking is that financial information can be organized around specific questions rather than presented as disconnected records.
For example, a finance manager may use dashboard information to identify accounts or financial activities that require additional review.
8. Helps Monitor Inventory and Operations
Inventory performance can directly affect purchasing, sales, fulfillment, and customer service. Relevant operational KPIs may include stock-related information, product movement, purchasing activity, and other inventory indicators.
A dashboard can give inventory managers a high-level view while allowing them to investigate individual products or transactions when necessary.
This can make operational monitoring more systematic and reduce dependence on manually prepared reports.
9. Enables Role-Based KPI Monitoring
Different employees need different information. A CEO may need a broad business overview, while a sales manager may need sales-specific KPIs and an inventory manager may require stock-related information.
A good dashboard strategy therefore avoids presenting every available metric to every user.
Instead, organizations can organize dashboard information according to roles and responsibilities. This helps users focus on the indicators that are relevant to their work.
10. Makes Reporting More Action-Oriented
A report can tell users what happened, but a well-structured KPI dashboard can also help them determine what deserves attention next.
For example, if a KPI changes significantly from its expected pattern, the user can investigate the underlying transactions, records, or processes.
This creates a connection between reporting and action:
Data → KPI → Visual Dashboard → Analysis → Business Response
That relationship is one of the main reasons KPI-based dashboards are useful for operational management.
Important Elements of an Effective Dashboard in Odoo
Creating a dashboard is not simply about adding as many KPIs as possible. The quality of the dashboard depends on how the information is selected and organized.
Relevant KPIs
Every KPI should answer a meaningful business question. Avoid including metrics simply because the data is available.
Clear Visualizations
Charts, tables, graphs, and KPI indicators should be easy to understand. Users should be able to recognize important information without unnecessary complexity.
Consistent Data
Dashboard information is only useful when the underlying records and business processes are maintained accurately. Incorrect or incomplete data can lead to misleading reporting.
Appropriate Time Periods
Some KPIs are more useful when reviewed daily, while others may require weekly, monthly, quarterly, or longer-term analysis.
Drill-Down Capability
Where supported by the Odoo configuration or reporting tools, users should be able to move from a high-level KPI toward the underlying information for investigation.
Best Practices for Using Odoo KPI Tracking Features
Businesses can improve their KPI strategy by following several practical principles:
- Define the business objective first. Determine what the organization needs to measure.
- Select meaningful KPIs. Focus on metrics that support specific decisions.
- Avoid dashboard overload. Too many indicators can reduce clarity.
- Use consistent data sources. KPI reliability depends on accurate underlying information.
- Review KPIs regularly. Business priorities can change over time.
- Organize dashboards by user role. Different departments require different performance views.
- Combine summary and detailed analysis. Use dashboards for monitoring and underlying records for investigation.
- Document KPI definitions. Users should understand exactly what each metric represents.
Odoo KPI Tracking and Business Intelligence
KPI tracking is an important part of broader business intelligence because it helps organizations turn operational information into measurable performance indicators.
However, KPI tracking should not be confused with complete business analysis. A KPI tells users about a particular measurement, while deeper analysis may require examining multiple variables, historical patterns, business processes, and underlying records.
Using Odoo KPI tracking features together with a well-designed dashboard in Odoo can therefore create a practical starting point for business intelligence. Users can monitor important indicators first and conduct deeper analysis when necessary.
Common Mistakes to Avoid
Several issues can reduce the usefulness of KPI dashboards.
Tracking too many KPIs: A dashboard crowded with metrics can make important information difficult to identify.
Using irrelevant KPIs: A metric should relate to a specific business objective or decision.
Ignoring data quality: Inaccurate source data can affect the reliability of dashboard results.
Failing to define KPIs: Users may interpret the same metric differently if its calculation and purpose are unclear.
Treating dashboards as a replacement for analysis: Dashboards provide an overview, but complex business questions may require detailed investigation.
How to Build a KPI-Focused Dashboard Strategy
A practical approach can begin with five stages:
Stage 1: Identify objectives
Determine the business outcomes that need to be monitored.
Stage 2: Select KPIs
Choose measurable indicators directly related to those objectives.
Stage 3: Identify data sources
Determine which Odoo applications and records provide the required information.
Stage 4: Design the dashboard
Organize KPIs according to user roles, priorities, and reporting needs.
Stage 5: Review and refine
Evaluate whether users can understand and act on the information. Remove unnecessary metrics and adjust the dashboard as business requirements change.
EEAT Considerations for Odoo KPI Dashboards
From an EEAT (Experience, Expertise, Authoritativeness, and Trustworthiness) perspective, businesses should avoid treating every dashboard metric as universally applicable. KPI requirements differ by industry, business model, department, Odoo configuration, and organizational objectives.
Experienced Odoo users and implementation teams should document how KPIs are calculated, identify their underlying data sources, and explain what each metric is intended to measure. Organizations should also validate dashboard information against their operational records before using it for important business decisions.
This approach makes dashboard reporting more transparent and helps users understand the context behind the numbers.
Conclusion
Odoo KPI tracking features and a dashboard in Odoo can complement each other by turning important business information into measurable, accessible performance views. KPI tracking establishes what the organization wants to monitor, while dashboards provide a practical way to present and review those indicators.
When businesses select relevant KPIs, maintain accurate data, organize dashboards around user roles, and connect metrics with specific business objectives, Odoo reporting can become more useful for ongoing performance monitoring and analysis.
The goal should not be to create the dashboard with the largest number of metrics. Instead, an effective dashboard should present the right KPIs, to the right users, in a format that supports meaningful business analysis and action.